

When building new well forecasts or trying to explain existing well performance, reservoir engineers find themselves in the difficult position of trying to normalize for a multitude of variables at the same time.
How can I include production from this one-mile lateral?
This frac design is using 2/3 of the proppant we use today, how do I normalize for it?
Did this well underperform due to poor reservoir quality or aggressive downspacing?
These multidimensional variations are the reason why so many reservoir teams are adding multivariate modeling to their forecasting workflows. The interactions between geology, well design, offset interactions, and well performance are impossible to tease apart without the help of computer algorithms. Despite the recent adoption of multivariate models and machine learning workflows, a great deal of skepticism remains within the industry.
In order to prove its viability in a forecasting workflow and overcome skeptics, a model must be both accurate and explainable.
Accuracy is relatively easy to test and report on as many cross-validation techniques exist to measure a model’s accuracy (at PetroAI we use 5-fold cross-validation). Explainability, however, is much more difficult to quantify.
Shapley Additive Explanations (SHAP) values can be helpful in explaining the contribution of each feature toward a final model prediction.
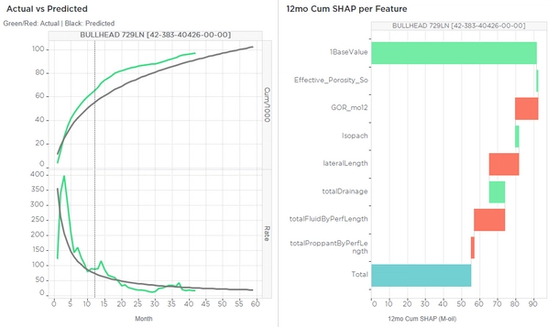
The SHAP waterfall plot shows how the model arrives at its prediction from the base, or mean value of the data set. Models created in PetroAI use a combination of engineering, geologic, and calculated features. An example of a calculated features is totalDrainage, created from the Frac Fingerprint for the well which captures well spacing and well interaction effects.
When evaluating any PDP well, a reservoir engineer can use the SHAP values to understand and quantify the various drivers of production.
The well shown in the figure has a negative contribution for fluid which would indicate that the well could have been improved with a higher fluid concentration. Mutliple wells can be compared to see how the different features impact their production and where the biggest differences arise.


