

Well production is influenced by a variety of well design, well interaction, and subsurface attributes, yet forecasting workflows do not account for these critical features in a robust way.
Instead, typical type curve work begins by ignoring subsurface characterizations entirely, choosing nearby analog wells. Once curves are matched, rule-of-thumb adjustments for proppant loading or parent/child interactions are applied to the given curve (e.g. 20% uplift for frac intensity with a 10% discount for child well effects).
Not only are these status quo workflows inaccurate, but they are limited in their applicability beyond local well control.
With an increased focus on inventory quality and exploration upside, quantitative forecasts that take advantage of all available data are critical in making capital allocation decisions. This is why many reservoir engineering teams are adopting multivariate analysis into their type curve workflows.
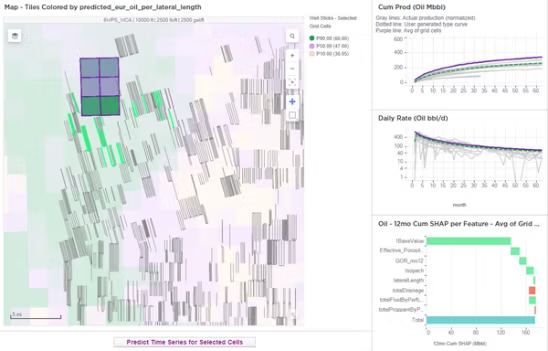
Figure 1: Analog wells have been selected and their actual production has been normalized to 10k laterals. This production is shown in the line plots as grey lines. A P50 aggregation was used to create a type curve which is shown as the dashed green line. A performance heat map was then layered on the map for a 6 WPS development at 2500 lb/ft and 2500 gal/ft in the WCA. The purple line shows the average predicted production for the selected cells.
Asset teams using PetroAI make multivariate models for well performance that can use large numbers of wells which helps to capture trends and tradeoffs. These models also bring in subsurface properties so that changes in geology can be quantified. With PetroAI’s unique Frac Fingerprint technology, the effects of well spacing can also be accounted for in the predictions.
PetroAI allows engineers to design an entire pad configuration and see how well performance varies across a DSU or across a basin.
For example, the performance of a single well at any location might be of interest, but the development plan requires engineers to weigh the tradeoffs between 4, 6, or 8 WPS (or maybe even different wine rack configurations). PetroAI can be configured to run all these designs to generate performance heat maps as seen in Figure 1 above.
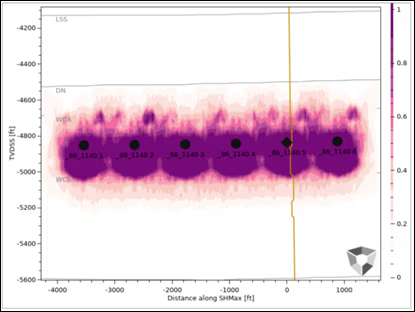
Figure 2: The gun barrel shown here is the DSU design for the sample predictions in Figure 1. At 6 WPS the wells are just beginning to show signs of interactions.
The MV Type Curve workflow from PetroAI lets engineers filter down to analog wells and create a type curve using traditional approaches. Users can also choose a specific well design and then select grid cells to view the model prediction and SHAP values. The example in Figure 1 shows the performance heat map for a 6 WPS WCA development at 2500 lb/ft and 2500 gal/ft. The purple lines on the rate and cum plots shows the average predicted production for the selected cells. The gun barrel of this sample pad design is shown in Figure 2.


