

Well performance can be highly impacted by the presence of offset wells and the distance to those wells.
Most teams that build MV models to predict well performance incorporate some sort of well spacing features. Average horizontal distance or minimum horizontal distance are commonly used but there are many others. The timing of the offset wells is also important and so features like offset distance at drilling time vs offset distance today might be used to capture the impact of infill development.
PetroAI takes a unique approach by creating an engineered feature to capture well spacing, well interactions, and geomechanics in a single parameter.
We call this feature “total drainage”. It consists of a predicted frac cross section, called the Frac Fingerprint, multiplied by the lateral length to get a volume.
The Frac Fingerprint is based on a deep learning model trained on processed frac diagnostic data (e.g. microsesimic data) or frac simulations in the area. The Frac Fingerprint response is tied to the local stress profile at the well location. Fractures can grow up, down, or stay in zone, depending on the characteristics of the stress profile. The Frac Fingerprint can be thought of as a prediction of the stimulated area around a wellbore.
The Frac Fingerprint is not a frac simulation. It would be computationally impractical to run a frac simulation on every well in a basin. However, using the Frac Fingerprint we have a surrogate model for drainage. This feature scales with well spacing and accounts for well interactions.
A critical step in the PetroAI feature generation pipeline creates parent, child, and sibling classifications for each well-to-well pair in the data set based on user inputs.
The distance between two wells and the difference between their completion dates will determine the classification. Each well can have multiple parent or child wells and can be both a parent and a child relative to its offset wells. The Frac Fingerprint uses these classifications to stitch the cross sections from each individual well together with its neighbors.
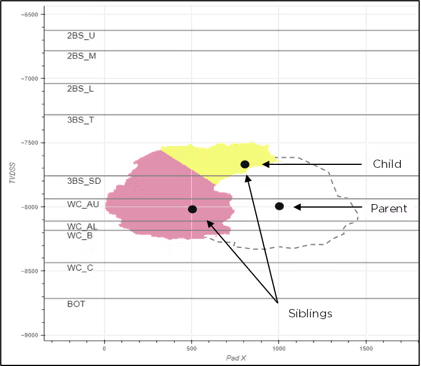
The Frac Fingerprint for each well is calculated in isolation and then adjusted based on the offset wells to maintain a conservation of volume. When the Frac Fingerprint from two sibling wells overlap, the area is divided using a closest well allocation logic. This approach allocates the stimulated area to each well based solely on distance to the well, not on which well generated the stimulated area.
Parent wells take all available area touched by their Frac Fingerprint. The Frac Fingerprint for child wells will have its area reduced by the amount already taken by the parent well. This can create a much smaller available area for child wells.
The Frac Fingerprint not only responds to vertical stress, but scales with well spacing and accounts for parent-child interactions.
The Frac Fingerprint can be convolved with well logs to produce additional features. This can be particularly important when the frac is predicted to grow out of zone and might contact less productive rock. Commonly, the Frac Fingerprint will be combined with an oil saturation log to capture vertical changes in geology.
The application of the Frac Fingerprint is based on several assumptions that simplify the computation. The vertical stress is assumed to be constant over time. Stress data is often available in the form of pilot hole logs, DFITs, or ISIPs; however, after wells are put on production, the effects of depletion can change this profile. Similarly, the completion of one well can lead to an increase of local stress: affecting subsequent sibling wells. The Frac Fingerprint can be applied under different what-if scenarios to test variations in the vertical stress, but ultimately it creates a discreate prediction under static conditions.
A related assumption is that fracs are symmetric along a vertical plane placed through the wellbore. As before, depletion effects can cause a frac to bias toward a parent well. If wells are completed in the same target zone the vertical stress profile remains unchanged, but the depletion occurs horizontally from the offset well. While this effect can be observed through frac diagnostic data, it is impractical to deploy additional field services on every well in a development area.
The Frac Fingerprint is modeled independently from completion intensity. Its dimensions change with stress; whereas fluid and proppant intensity are introduced as independent variables elsewhere in the production model.
Even with these simplifying assumptions, we have found the “total drainage” feature to be highly informative in capturing well spacing and well interaction effects. It also allows us to run sensitivities on well placement.


