

Creating accurate forecasts for inventory locations is challenging due to both the large number of potential locations and the many variables impacting well performance. Future wells are typically assigned a type curve and adjusted using a risk factor to account for well specific unknowns (e.g. reservoir quality, parent well distance). This approach results in high uncertainty in the expected performance and economic value of future locations. With PetroAI, engineers can create unique predictions on inventory locations that account for geology, well design, offset PDP wells, and the timing of development.
Multivariate Type Curves
As detailed in other blog posts (Introducing Multivariate Type Curves, Empowering Asset Teams with AI), engineers use PetroAI to curate a data set and then build a ML model for an area of interest. Engineers can then upload a CSV template of inventory locations to create unique time series predictions for each location. The inventory template contains the information needed to create a virtual well inside PetroAI. This table includes a unique identifier, a target interval with relative landing, and coordinates to specify surface and bottom hole locations.
PetroAI Cloud then uses these inputs to create a drilling survey and run the feature extraction process on the location. This allows each inventory location to be landed in the correct target, have any available geologic attributes interpolated on the well, and have all well interactions classified. PetroAI will also predict the drainage volume for the inventory location using the same Frac Fingerprint technology applied to PDP wells. All the wells can be assigned the same future completion date to make a comparison on well performance or NPV. Alternatively, the locations can be assigned unique completion dates that account for some development schedule. In this case, any future parent/child interactions can be incorporated into model outputs as they will be captured in the unique Frac Fingerprint for each location.
Comparing Predictions vs PDP
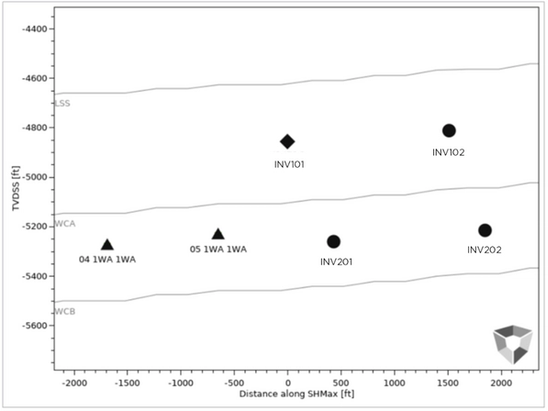
After running through PetroAI, the locations can be viewed alongside existing PDP wells on both maps and gun barrels. The figure below shows one of the automatically created gun barrel views for the INV101 location. In this example, the selected INV101 is the active well, the two triangles represent parent wells while the three circles are sibling inventory locations.
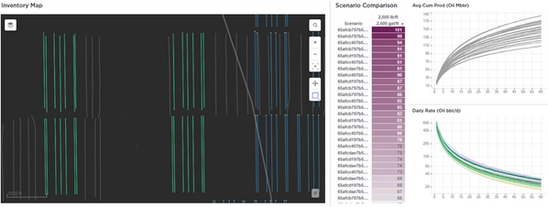
Engineers can compare the predicted performance of the locations using a variety of plots and tables. The example below shows the locations ranked by 12-mon cum oil which makes it easy to identify the best and worst expected performance across the locations.
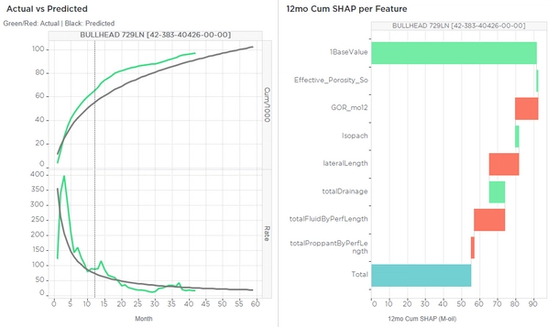
Each inventory location has its time series prediction and SHAP waterfall that explains how the model arrived at its prediction. This allows engineers to not only compare the relative performance of the locations but also to understand why one location might be better than another.
Beyond Type Curve Areas
Rather than making a one-time prediction on inventory locations, engineers can update the forecasts at whatever frequency they choose. For example, when new well data becomes available the underlying model can be re-trained and the predictions updated. This ensures that the model is trained on all available data, learning from any offset operators that might have recent analog wells brought online. Similarly, if any subsurface properties are updated, the new geologic interpretations can be fed into the system and will flow through to the inventory predictions.
The result is an intuitive, dynamic, and highly predictive system that can supercharge shale engineering work. Rather than a painful, multi-month exercise that is performed every couple of years, inventory valuation becomes an evergreen, dynamic process to better inform capital allocation.


