

New Feature Alert!
In a previous blog we shared how engineers could use PetroAI to create traditional type curves using offset analog wells and a multivariate approach that uses an AI model trained on well and subsurface properties. The multivariate approach allows engineers to move beyond simple analog well comparisons to build unique type curves that capture influences from completion design, well spacing, and geology.
PetroAI recently released several new features that help facilitate both a traditional type curve workflow as well as the AI model version.
Saving Type Curves
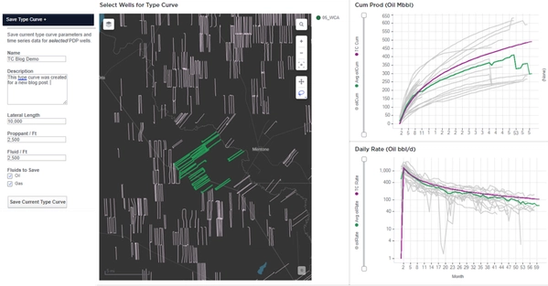
We refer to a traditional type as one where an engineer has hand-picked offset wells, normalized for lateral length, and customized a DCA curve. This is accomplished in PetroAI using MV Type Curve Generator dashboard and the Explore Wells and Type Curve tabs. Users can customize the type curve, for example, by adding flat time or tweaking the auto-fit b-factor. Once happy with the type curve, they can save it inside PetroAI.
Saved type curves are visible under the Type Curve tab inside PetroAI. Along with the curve parameters, key meta data is also captured. In addition to who created the type curve and when, all well IDs that went into making the curve are saved along with their well header columns. The type curves can now be easily organized, managed, and shared.
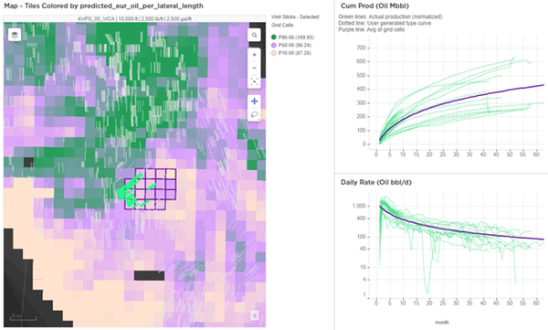
A similar workflow can be followed to save a MV type curve. Once a user has selected the desired cells in their MV scenario they can tweak the type curve parameters and save it. In this case, metadata around the design scenario and the selected cells are saved along with the curve parameters. For example, an engineer might want to create a type curve in Reeves County for a 4 WPS, 10k lateral, 2500 lb/ft scenario in the WCA. This information is stored along with the decline parameters.
Managing Type Curves
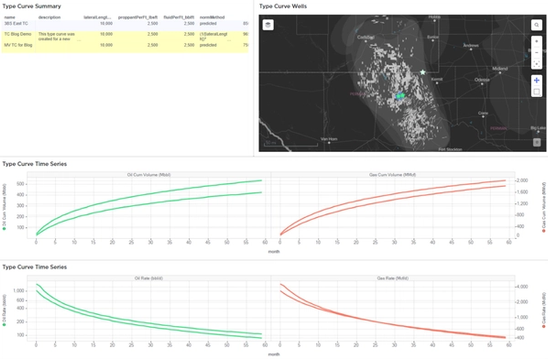
A new dashboard was also created to help view and manage the type curves. This Type Curve Manager dashboard can be found under the Insights tab of PetroAI. The dashboard will display all type curves that have been saved to that repository. Here the curves can be viewed, compared, or exported to CSVs.
The map in the upper left corner shows the mean latitude and longitude of the type curve (using either the analog wells or the MV grid cells). The plots across the bottom can be used to view a single type curve or compare multiple curves.
These new features make it easier than ever for engineers to apply the PetroAI technology to their workflows and make higher confidence forecasts.


