

Q: How does perf erosion influence perf cluster design and stage optimization?
A: “Perf erosion is going to be a good indicator of perf efficiency,” Kyle LaMotta, VP of Analytics explains, “It’s an indication of whether you’re placing proppant in the perforation. If you don’t see any perf erosion that means you probably didn’t put any proppant in those particular perfs. We’re able to predict that.
“We can also make a prediction for treating pressure over time for each stage and from that we can calculate what the pressure drop across that perforation is. By being able to do that we can change the design to get to the idealized limited entry target which would be a pressure drop.
“Let’s look at an example of the perf erosion indicator for our hypothetical company, Turing Assets, and talk about how that can be used to optimize the design.
“In the Drilling Spacing Unit Design Service (DSUDS), we have an app, the Treating Pressure Prediction (TPP) App, that will make a prediction of treating pressure at every stage.
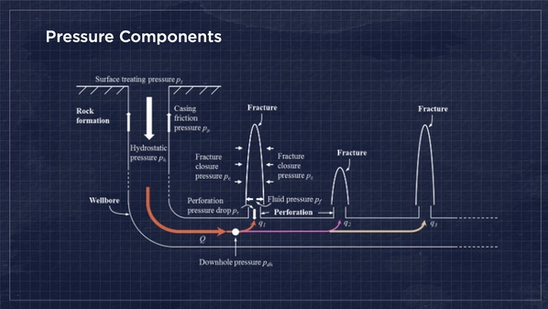
“There’s a number of inputs to that. The treating pressure at the surface is going to be a function of the fluid type that you’re using, the rate at which you’re pumping, the dimensions of the pipe that you’re pushing it through, and the size and number of perforations. You’re basically calculating all the pressure drops through the system and then calculating what that treating pressure would be at the surface.
“It's also very dependent on the minimum horizontal stress in the rock at the location of each stage. That in situ stress is something that we predict, the SHmin at each stage, which becomes part of the Geo Model.
“First, from Turing Assets company’s perforation design, we’ll get the size of the perforations and the number of perforations for each stage.Then we make a prediction of the treating pressure at each one of those stages.
“The treating pressure is being predicted over time. If it takes two hours to pump the stage, we’ll have a prediction at certain time increments. So, for Turing Assets let’s say it’s every one second. As we’re measuring and predicting that treating pressure over time, we can see how that treating pressure is dropping.
“We can back out all the other pressures that we know are in the system. If we just want to focus on the perf erosion, that can be measured by understanding the change in pressure drop at the perforations. As the perforations get bigger, that pressure drop is going to decrease.
“When you start the job, you’re going to have a really high pressure drop across the perforations but as that perforation gets wider that pressure drop is not going to be quite as big because you have a bigger hole to push the fluid through.
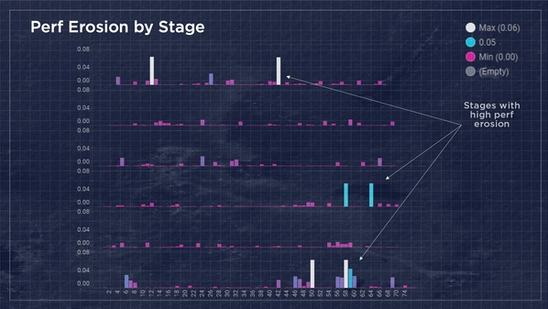
“The calculations of the model provide this Perf Erosion by Stage report. For Turing Assets we notice there are very few stages that have high perf erosion. For this well in particular, there is really no indication that there was a lot of perf erosion.
“You don’t want too much perf erosion because you’re going to have a hard time initiating the fracs. But you do want some perf erosion because that’s an indicator that you’re pushing sand through those holes. As you’re pushing the high-pressure sand and water through the holes, you’re going to erode the perforations and they’ll get bigger.
“Turing Assets had already run dark vision, a camera that they put down after they fracked the job, which measured the perf size after the treatment. They noticed visually that the perf diameter didn’t change very much before and after the job. That’s exactly what we predicted, that there wasn’t much perf erosion at all.
“Corroborating this for Turing Assets was great for Petro.ai. Our model predicted exactly what they had seen and helped them understand the reason for this low perf erosion in terms of pressure. Petro.ai with predictive AI provided the same information as the visual check. This was an important look back. How could we use this going forward?
“The beauty of this is that you could model different completions designs changing the number of perforations, the number of clusters, the size of the perforations, and by making predictions you could start to understand what pressure drops are going to achieve your limited entry targets.
“The idea for limited entry is you want lots of stimulation near the well bore. You have lots of perforations as opposed to few perforations and have close cluster spacing. You put a lot of perforations and put those perforations close together, so that you make a lot of contact with the reservoir.
“By measuring that pressure drop across the perforations, you can start to understand what design would achieve that optimal limited entry target that you’re trying to reach. Perf erosion becomes a significant signal for stage optimization through the pressure calculations provided by the DSU Design Service and Petro.ai.”


