
Q: What are partial dependency plots (PDP)?
A: Kyle LaMotta, VP of Analytics explains, “The partial dependency plots (PDP) are one of the model diagnostics that we’ll use in every DSU Design Service analysis. The PDPs are a way to visualize how a feature is contributing to a prediction.

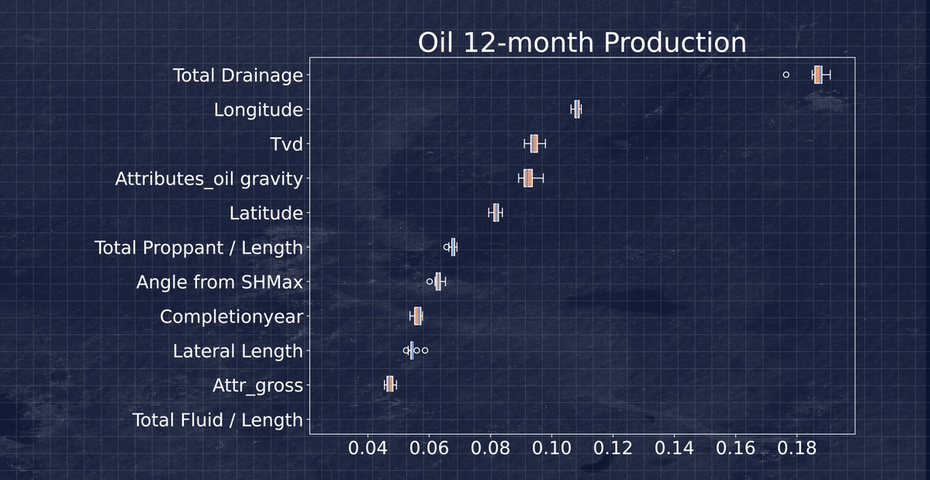
“I’ll start by showing the feature importance plot. The feature importance is telling us how the features are contributing to the overall model accuracy. In this example, total drainage is the most important feature followed by longitude and TVD (total vertical depth). The absolute values on the x-axis are much less important than the relative values of each feature. In other words, looking at the weighting of each feature’s contribution to the model.
“Here we can see that total drainage, longitude and TVD are important features in the model. Without them the model would be less accurate. If we wanted to see how changes to total drainage are affecting the model’s prediction, we can use these PDP plots.

“The PDP plots above are going to tell you what the model is predicting for various values of a given feature – all else equal. The PDP methodology holds all other features constant in the model, while increasing or decreasing the feature of interest.

“It’s a way to see, for a range of lateral lengths, if every other feature had its average value, how does changing the lateral length change the prediction? In this example, the lateral length is a linear trend from 4,000 ft to 12,000 ft.


“We’re seeing different trends in the data. Lateral length, proppant, and fluid are common variables that a customer may want to change. We can see for total fluid per foot in the PDP plot above; it’s relatively flat, but increasing linearly. As far as proppant loading goes, you can see that it is increasing early on, but relatively flat between 1,500 lbs/ft and 2,500 lbs/ft. This indicates that changes within this range of proppant loading, on its own, does not have a material impact on the output of this model.
“If we change the wells in the training set or if we remove a feature, then the PDP plots will change. We’re constantly investigating PDP plots as we’re iterating on new models.
While these plots are very helpful for model investigation, a viewer must be thoughtful about data density and any extrapolation the model may be making. We visualize this with a tick mark histogram along the x-axis as a visual check for data density.


