

Some productivity drivers in a tight reservoir are observable and easily measured. You can see for yourself by creating a cross plot of lateral length with 12-month production. The correlation jumps off the screen.
But what about effects on well productivity that are harder to measure, more subtle, or even interact with other factors? We must use more sophisticated techniques to capture the impact of these factors: multi-variate regressions and physics-driven feature engineering.
For example, consider the concept of well drainage. This is an easy concept to incorporate into a mental model, but creating predictions based on drainage is far more difficult. Drainage is influenced by a myriad of factors, most of which are hard to measure or not available. The interplay between a growing frac and the rock, coupled with the engineering design of the stage, influence production similarly to lateral length. Drainage can be a better production proxy than lateral length, but we avoid using it because it’s hard to estimate and quantify.
To correctly account for an envelope around a well, several interacting measurements must be layered together. That’s why we made the Frac Fingerprint.
Drainage is just one of the many other reservoir properties that could be influencing productivity and other critical decisions - parent/child well offset is another powerful example.
In order to apply more complicated factors into economic forecasting and DSU design, it’s necessary to embrace “multi-variate thinking”. Regardless of the regression model used, teams can use this framework to interrogate a multi-variate relationship in a simpler and more intuitive way than traditional cross plots.
At Petro.ai, we approach this holistically. Each discipline on the asset team can input their assumptions, characterizations, and data in the area of interest. We verify that all of the team’s individual contributions come together by making blind predictions on hold-out pads (groups of wells held out from the training set). To further increase confidence in our methodology, these hold-out pads are deliberately chosen to be analogs for our designed DSU. In more traditional reservoir engineering workflows, a local type curve would have been generated from these same analogs.
Once the model is tuned and calibrated against these blind analogs, teams examine tradeoffs using a “multi-variate thinking” approach.That means delivering sensitivities rather than cross plots.
Sensitivities are like a cross plot, but can be considered as a continuous profile. This is due to the fact that all other variables are held constant, allowing team members to examine the effect on productivity for only one aspect. Under the hood, the machine has assembled all of the relationships between all productivity drivers and automatically built correlations capturing the constraints trained by the various members of the asset team. This replicates the very human process of examining lots of bi-variate relationships to come up with a higher-dimensional belief. It’s like stitching a 4D mental image from lots of 2D pictures.
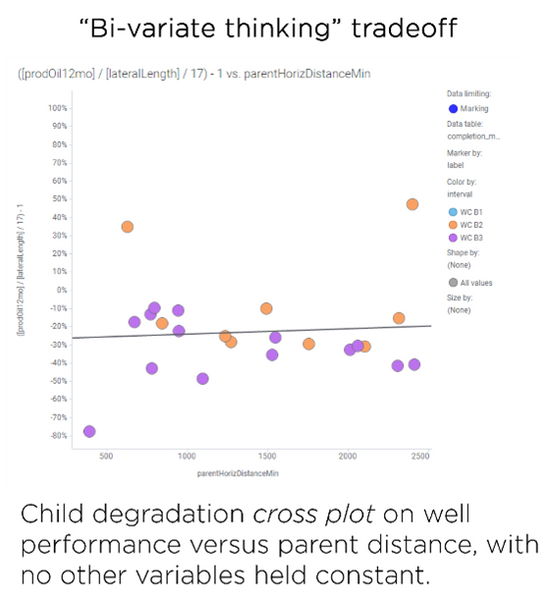
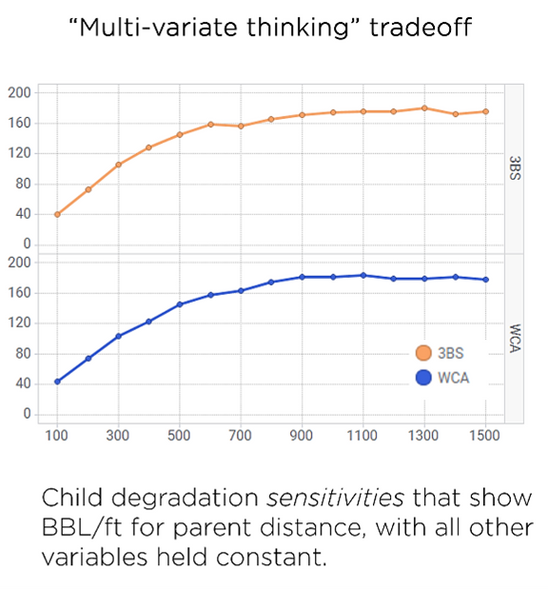
As an example, here’s an output of our child well degradation calculations. On the left, you get cross plot relationships with huge gaps in coverage or small gaps with unexplainable differences in outcome. On the right, we see an output created using the Petro.ai process. It is much easier to read and see the effect of degradation at a variety of spacing arrangements.
How accurate is it? The system outputs accuracy as predicted versus actual of analog pads – in this case a P10/P90 ratio of 1.1x.
When there’s trust in a multi-variate system, it’s an easier way to collaborate across disciplines, as the visual outputs of the system make intuitive sense to everyone.
As you plan for this next wave in shale, and whether you already have a strong multi-variate culture in place or are interested in bringing it in, Petro.ai can help provide the features, models, and outputs that make this shale workflow transformation successful and sustainable.


