CSV: In Petro.ai, it’s two clicks and a download
CSV: "In Petro.ai, it’s the best you’ve ever seen in O&G." —Troy Ruths, CEO of Petro.ai
Downloading and using the well stats that you’ve created inside the Petro.ai Platform is a crucial step in your continuing production analysis.
You can create a Well Stats Summary from the Forecast Scenario or view your wells in the extremely rich 3D earth model to validate the numbers. Then you can take that group of wells, download the CSV and bring it into Spotfire to do a multivariate analysis or even send it through Excel. Ruths emphasizes: "Whatever your preference, this CSV is awesome."
It has everything you need to know about your well:
- Where it’s landed
- How many associated sibling, parent, child wells
- Spacing information
- EURs
- EURs normalized per foot
- Lateral lengths
- XY locations
- Production statistics
- Shmax orientation
"This is a living product for us and every time we bring in a new data type we add to it,” says Ruths.
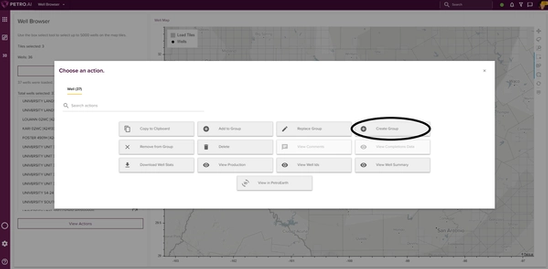
Building that CSV file is easy in the Petro.ai Platform. Create a group of wells in a Petron, or shareable workspace, either by uploading a file or using the Well Browser app.

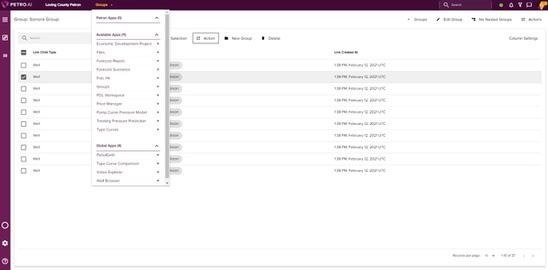
Or go to the Groups App to select a well that you’d like to review.

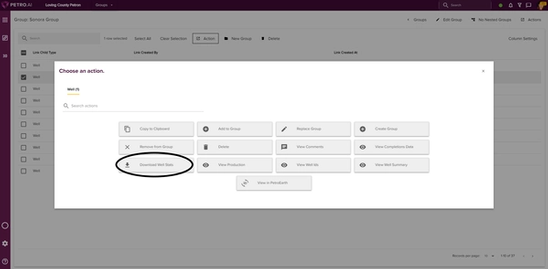
Click Actions to launch the "Choose an action" pop-up. Then select Download Well Stats.

When you open the downloaded CSV file, you’ll see your wells in rows with over 120 columns of different well statistics.


