Digital Twin: Petro.ai creates a real-time digital counterpart of shale reservoirs, integrating well data, production, and subsurface data like stratigraphy and geomechanics. We integrate data as it becomes available, so it is always up to date. We have AI models that learn from the digital twin to make predictions of well performance and optimal development plans.
Blind Test: A blind test in machine learning is when you hide data from the machine learning model so it can't use it when you're building and calibrating the model. Then you use the model to make a prediction for the blind test data to see how it does.
Lowering costs is a permanent part of the Oil & Gas Industry. With Petro.ai, each point in the well lifecycle can be addressed for economic viability.
According to Bill Maloney in Forbes, “Lowering cost requires the relentless pursuit of improving efficiencies in every aspect of the value chain. Oil and gas companies can lower technical risk with better reservoir models, better visualization and more.” Better reservoir models and better visualizations with applied economic constraints is the central feature of Petro.ai.
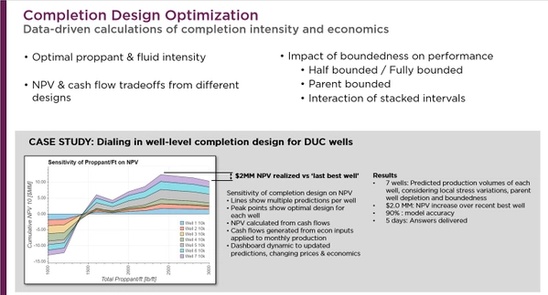
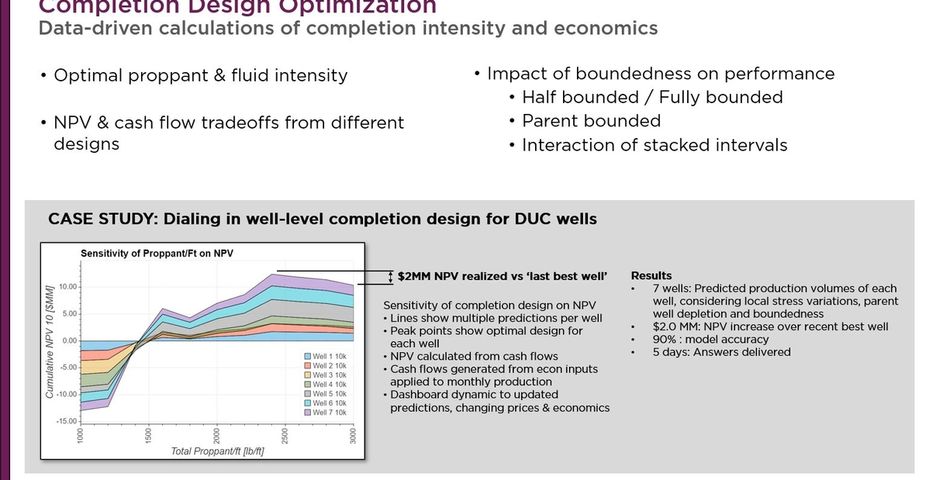
Dr. Brendan Hall, VP of Geoscience, explains a recent case study using those Petro.ai models, “A client asked us to use a Digital Twin to perform a sensitivity analysis, or an optimization problem basically, to determine the optimal proppant amount that they should use to complete a set of wells, maximizing economic KPIs, whether that’s NPV, net present value, cash flow, IRR, internal rate of return, or capital efficiencies.

“We took the Digital Twin that we had been calibrating and dialing in with the customer. We used their proprietary data that they had from their own wells and integrated that with data from public sources. We took some wells from an adjacent county to have a larger data set to work with. We built a baseline model that way, measured accuracies and successively iterated on that to dial it in.
“The accuracies we were seeing were good. Then with a blind test well, one that we held out when we were training the model, we achieved 92% accuracy. We were confident in the accuracy of the model. The next step was to make predictions for the pad in question with a whole series of different proppant values.
“We tested proppant values for 1000 lbs/ft all the way to 3000 lbs/ft. We got the results out per well production and that is what is shown in the plot above. We calculated the time series production for each of those wells which provided not only a production prediction at one point but production predictions that each well would return over time after it was turned on. That enabled us to calculate present value, PV, for each of those scenarios.
“The plot above, a multi-colored stacked line chart, shows the cumulative NPV for each well for all of the different proppant loadings. We can see that at 2400 lbs/ft, we reach an optimal balance of the amount of oil that’s going to be produced and the capital expenditure to put that proppant into the ground. That suggests that at 2400 you’re going to balance that out so that you’re not overcapitalizing your proppant investments. That’s the ideal point. What they were originally going to do was put 3000 lbs/ft there because that’s what somebody did nearby.


