


Charles Connell, VP of Product explains this new functionality, “The fastest way to browse well data is often through a map. It’s a way of looking at data that is very familiar to engineers and geologists who may have multiple maps to show different data. We recently expanded Petro.ai Earth to include a 2D map view as well as the 3D subsurface view. Users can now browse data in 2D or 3D and quickly flip between the two. This allows for an immersive experience not only for browsing data but also for exploring well to well and well to reservoir interactions.”
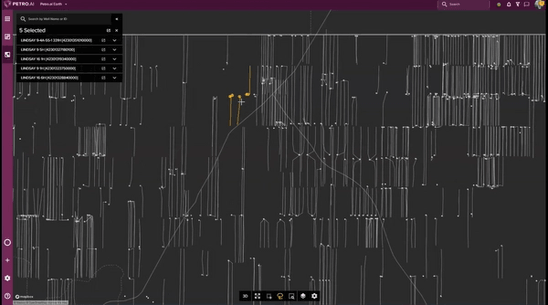
The new 2D map view, accessed through Petro.ai Earth, lassos wells for analysis, and zooms into a well stick view that not only connects surface and bottom hole location, but reveals a two-dimensional projection of the drilling survey.


Using the lasso tool from the bottom tool bar to select one well, open an info panel with access to all the information about this well.


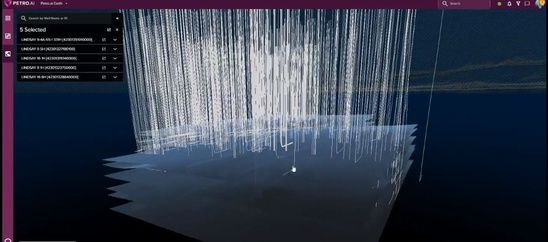
What makes this view of the map differentiated is that you can have some wells selected and be looking at those wells in 2D, and then flip over to 3D and see those highlighted wells in 3 dimensions with those surveys, see where they’re landing. In 3D mode, you can color these well sticks by different variables.

Note the mini map in the bottom left corner which references the 2D map while in 3D.

Some critical workflows that use the 2D version of the map view as a well browser start by filtering down to the wells you want to work with using options such as operator and/or completion year.

From there you can run the Frac Hit app on the wells that don’t have a Frac Hit Well Summary, so you can get all the well spacings and EURs for use in your own analysis.
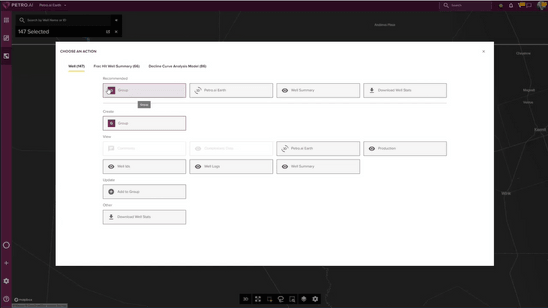
Some of the wells already have a Frac Hit Well Summary. You can quickly look at a Gunbarrel analysis of them.

Or you can look at a Rate vs Cum or Rate vs Time forecast for the 86 models that already have a decline curve.

You can also make these wells into a Group. The wells in this group can be used for further analysis in any of the applications and dashboards in the Petro.ai Platform including declining the rest of the wells. Or evaluate the spacing in Pad Designer.


