

Introduction
The Petro.ai Gun Barrel workflow allows the user to quickly find the 3D distances between the midpoints of the lateral section of selected nearby horizontal wells. This critically important information was once only possible to calculate using specialized geoscience software or through painstaking and time-consuming manual work. With the Petro.ai integrations, we can now calculate this information directly from Spotfire:
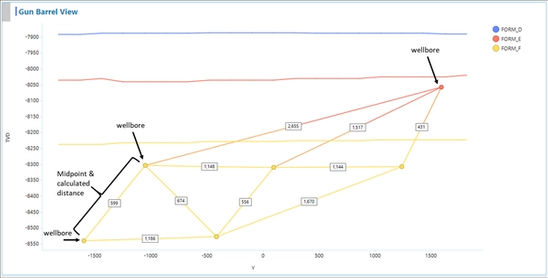
Figure 1: Petro.ai Gun Barrel View
Gun Barrel Overview
The Petro.ai Gun Barrel calculation finds the distances dx, dy, and dz between the horizontal midpoints of any combination of wells. The Gun Barrel calculates the 3D distances and delivers the information in a tabular format, which is then displayed in a series of user-friendly visuals. The calculation requires only two sets of data. Your wellbore directional surveys and the specific formation structure grids the horizontal wells lateral section is targeting. The final result, visualized in 2D & 3D using the Petro.ai Gun Barrel template, will look something like this.
- The top left chart shows a map view of each lateral, colored by classified formation
- The top right visual is an interactive 3D wellbore survey
- The bottom left chart shows the calculated distances in tabular format.
- The bottom right chart shows the namesake visualization, i.e. looking at the wells "down the barrel." We also show the formations as lines, projected at the midpoint of the lateral, when surface grids are available.
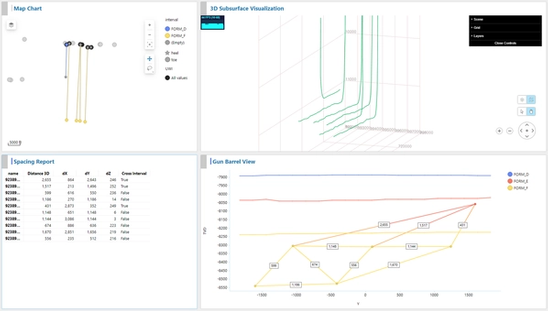
Figure 2: Petro.ai Gun Barrel Output Example
How it Works
Let's give a brief explanation of what exactly is going on. First you will choose a selection of wells on which to perform the calculation. These wells can be anywhere in the field, in any orientation and within any proximity to each other. That being said, it may be optimal to choose wells with relatively close offsets and similar midpoints. As seen in the example below, in the case of a group of horizontal wells, the Gun Barrel function will calculate the 3D distance from any lateral section midpoint to the next offsets lateral section midpoint.
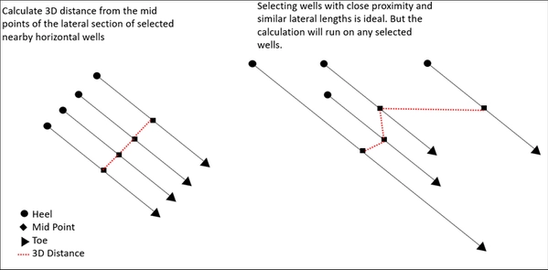
Figure 3: Choosing wells with relatively similar lateral section After the Gun Barrel function is run, a data table is produced with the 3D distance of each wellbore combination's respective lateral section midpoints, the dX, dY, dZ locations of these midpoints, and a flag indicating whether a formation interval was crossed between the two wellbores. Here's a visual explanation of each calculation:
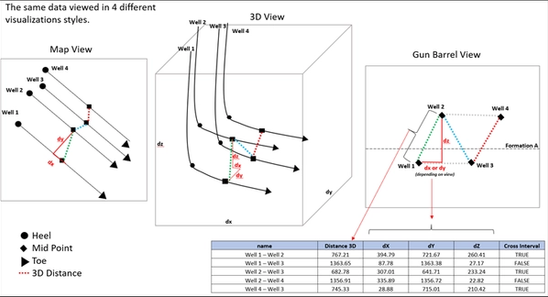
Figure 4: Multiple views of the spacing distances
As seen in the image above, the same data is displayed in 4 different formats, a map view, a 3D view, a Gun Barrel View, and a tabular view. Notice how each view is displaying the 3D distance from each well combination's lateral midpoint.
Now that we understand what the Gun Barrel function is calculating, the next blog post will focus on step-by-step instructions and required information to perform the calculation.


