

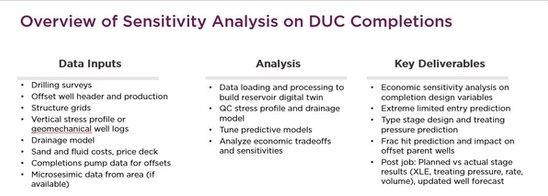
DUC Data In: Drilling surveys, offset well header and production, structure grids, vertical stress profile or geomechanical well logs, drainage model, sand and fluid costs, price deck, completions pump data for offsets, microseismic data from area (if available)
DUC Deliverables Out: Economic sensistivity analysis on completion design variables; extreme limited entry prediction; type stage design and treating pressure prediction; frac hit prediction and impact on offset parent wells; and for post job—planned vs actual stage results (XLE, treating pressure, rate, volume) and updated well forecast
Petro.ai’s Completion Scenario Analysis (CSA) focuses on the work needed to bring drilled but uncompleted (DUC) wells to production. Where for undrilled wells looking at well spacing or targeted landing is important, a DUC well has other decisions to be made. Certain concerns such as proppant intensity become more important in the completions stage of the well’s life cycle. And Petro.ai knows that working side by side with the asset team is vital to stay ahead of those critical decisions.
Numbers differ across the industry, but there’s no doubt that the inventory of drilled but uncompleted (DUC) wells has been reduced. Between past low oil prices and COVID, DUC wells were piling up, postponing a bulk of the well cost. With oil prices higher than they’ve been in years, $70/bbl, DUC wells are a great first resource to increasing production.
“In terms of completions, we’ve had a lot of success at Petro.ai saving our clients real dollars on the amount of proppant concentration that’s needed for a well,” Charles Connell, VP of Product at Petro.ai explains.
“We apply our drainage solution and model sensitivity on the proppant concentration. Historically, most concentrations that are used on a new well are derived from what was used on a last well, or nearby well. By employing the AI driven algorithms of the Completion Scenario Analysis (CSA), we’ve shown clients they can decrease their proppant concentration without affecting productivity. We’ve saved hundreds of thousands of dollars per well. On a multi-well pad? That really adds up fast.
“What is the interaction between your asset team and Petro.ai? This is a fully collaborative process. We want to be working alongside the asset team. We’re in the trenches with the operator. In the listing below you see the data inputs we’re bringing in, the analysis that’s provided in the CSA, and the key deliverables.The data that goes in makes the process very explicit. The analysis is automated; we run the tools. And the key deliverables are very concrete in terms of what we deliver to our clients to make critical decisions.”
Connell continues, “What we’re modeling here is what our clients want. They don’t want to give us the data, get a recommendation back and then decide whether to use it or not. Our clients want to see how the model is evolving, to QC the results, to provide input, to ask questions and understand the model. The flowchart below captures those activities. The top in yellow are the client activities. The bottom in purple is the Petro.ai team.
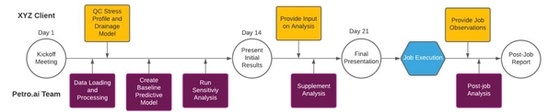
“We start with the kickoff meeting where we understand exactly what their use case is, what they’re trying to solve, what data they have available, what their timeline is looking like, and when they’re actually going to complete these wells. We’ll talk about the observations that they have of the asset. They may have been working on a particular acreage for many years and have a good feel for what’s happening. We’ll try to capture some of that human knowledge and make sure that’s built into our analysis as well.
“Then we’ll load the data. We’ll QC it and add those inputs. We’ll have a quick review with the client where we look at variables like the stress profile, the drainage model and provide insight on what they might see as being different or need adjusting. It’s important to get the client’s views early in the process because inputs like that stress profile are going to drive a lot of the downstream analysis. We don’t want to go all the way through the process, get to day 21, present the results and then have the client say, I don’t believe that the curve is this way. We want to get their feedback upfront.
“With that data, Petro.ai will make our baseline predictive model where we’ll get to an accuracy number. We’ll run the sensitivity analysis which is really producing the core results and present those to the client. Roughly, this can take anywhere from 7 to 14 days.
“We’ll look for feedback on that analysis. The client might have additional questions. Oftentimes, once the client sees the results, it will unlock other points that they’ll be interested in pursuing which will launch a supplemental analysis on our side.
“Then we go back and give the final presentation where we provide all of the deliverables and a curated data set. With that data set the client can do some additional in-house modeling. For example, many clients want to use the time series data to run additional complex economic calculations on it.
“But it’s not over at that point, we want to stay through the job execution and take all of the data acquired during the job to provide a thorough post job analysis and close that feedback loop from the modeling to the observations to the determination of improvements for the next time. A comprehensive report is provided for the client with all these results laid out in an easy to consume analysis.


