Today's post was created by data analyst Omar Ali. We’ll demonstrate how to create a multivariate model using the well-known diamond dataset from Kaggle. For this project, we’ll be utilizing the new Models feature in Petro.ai. Our most recent release makes it extremely easy to run predictive algorithms on any type of dataset. This tool is constantly being upgraded with added functionality and features per our customers’ feedback. That being said, let’s predict prices! Before we begin, please download the diamond dataset from the Kaggle page here. Before building a model, let’s first explore the data. We want to find all the blank values or anything that has an odd distribution first to make sure we’re going to build a model on clean data.
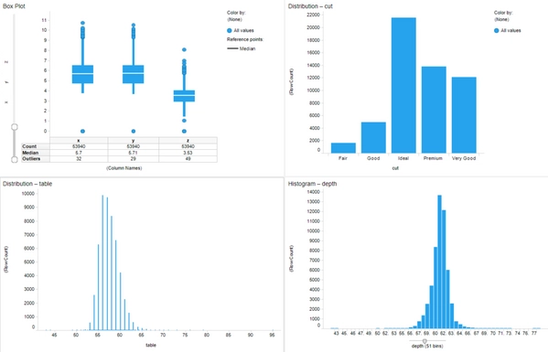
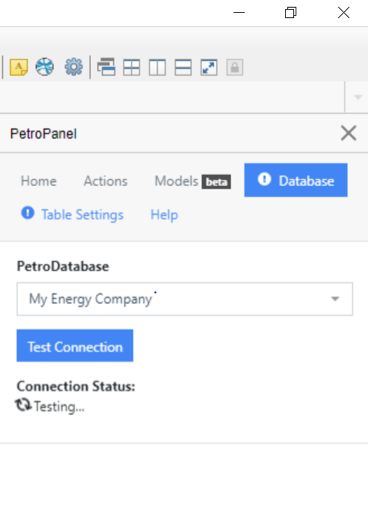
Some quick preprocessing shows us that there are some zero values in x, y, and z. The depth and table distributions should be fenced at the distribution to keep outliers from skewing the dataset, and there are no NULL values for our cut and color samples. The next portion of this exercise will familiarize you with the new Models feature in the Petro.ai. Click on the PetroPanel icon in Spotfire and select your respective database. Test your connection, and if it works, click on the “Models (beta)” tab.
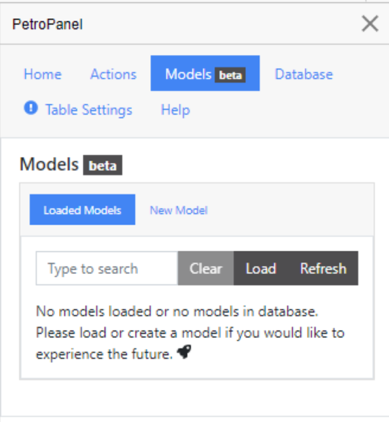
Once you’re in the Models (beta) tab, you should see the following:
Click on “New Model,” name your model, and click on “Create.” This will bring you the main tab where you can edit your inputs, choose a machine learning algorithm, and save and train a model. My Model Options tab looks like this:
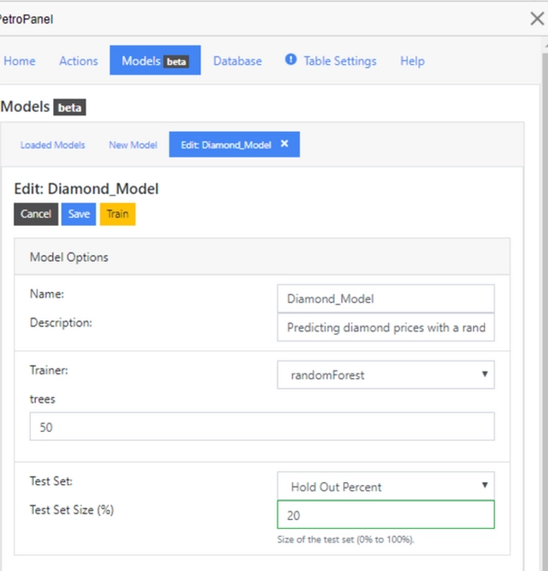
To predict prices, we’ll use a random forest with 50 trees and a 20% test set hold out. As you scroll down, you will find the Model Inputs tab. In this tab, you will point the PetroPanel to your table, select your predictors, and assign them to either “Categorical” or “Continuous.” For continuous variables, you can “fence” your dataset to keep outliers from skewing your model. For categorical variables, hot coding is the default, but a lookup table can be built as well. Here’s my Model Inputs tab:
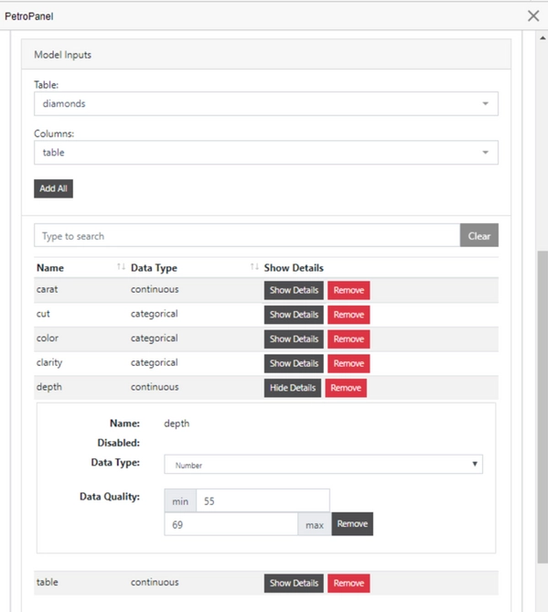
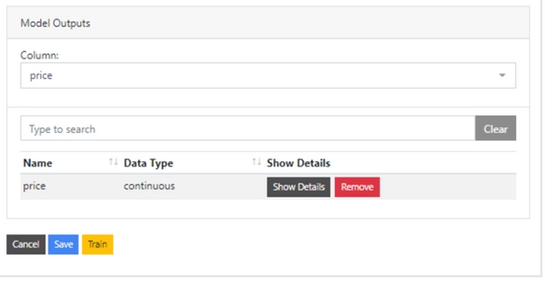
As you can see, I fenced the depth parameter from 55 to 69 to keep the outliers from skewing the dataset. Finally, the “Model Outputs” tab is where we can choose what we’re predicting, also with the opportunity to fence. Here’s mine:
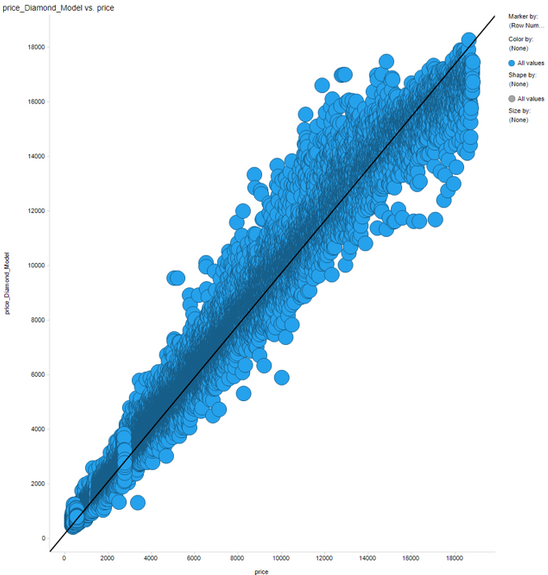
Once everything is ready, just click “Save.” Once you save, you can go back to the “Loaded Models” tab and should see the model populated there. All you need to do now is train the model and see your results! The predicted values for your dataset will be added to the original dataset. Below you can see a visualization of the price predicted by the actual price of the diamond.
The model result metrics can be found on the Petro.ai Suite under the “Machine Learning” tab. The Petro.ai Suite is independent of the Petro Panel within Spotfire and is fully functional on its own. From here, you can view the model inputs and outputs, the variable importance, and many other metrics that are required for model evaluation. Here’s what it looks like for the model I just trained:
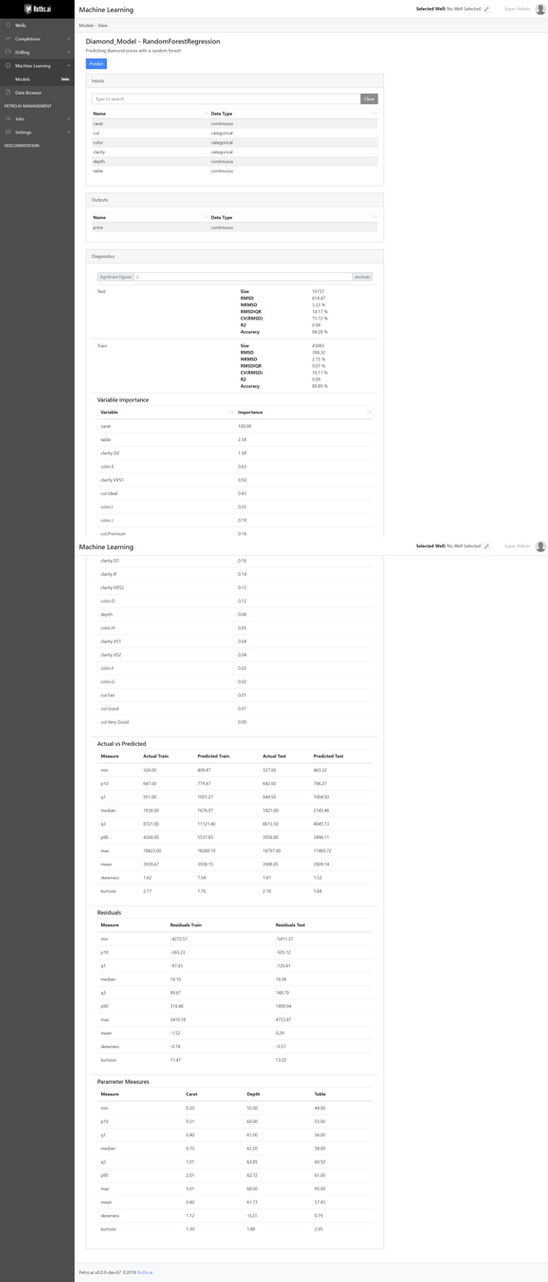
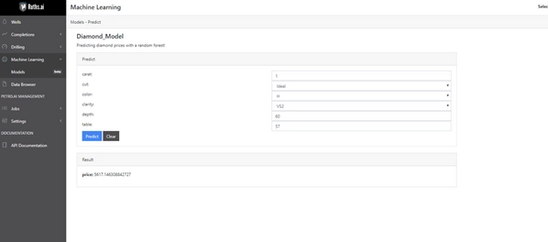
As you can see, we have a model with 84% accuracy on the test set. A key feature of the tool is that the model is already stored in our database, so we can create a job that runs predictions with this model at whatever frequency we decide on. This means that if we have a model that predicts diamond prices, the Petro.ai Suite can put it into production and the database will store the results. So, if we get diamond data daily, we can load in the data and predict the price through the Petro.ai Suite. If you’re looking for a one-time prediction, you can also manually enter in values for your predictions and generate a result to see how the model functions. An example of this can be found below:
I hope you enjoyed my demo of the new Multivariate Modeling feature in Petro.ai and the functionality of putting machine learning into production through the Petro.ai Suite. If you have any questions or concerns, please comment below!


