

Part two of this blog series builds on my last post and provides step by step procedures for dynamically calculating well spacing and building gun barrel diagrams with Petro.ai. The short video above from Kyle LaMotta highlights the key steps but keep reading for a detailed procedure of how this is done.
Required Data
The gun barrel calculation requires two sets of data; wellbore directional surveys and formation structure grids. It is also possible to run the gun barrel calculation without structure grids, but an additional data function is required.
The surveys must have X, Y, Z, MD, and a well identifier, and the X & Y should be shifted to the correct geo positions, not the X & Y offset values provided by the survey company. Check out this template if you need to convert a drilling survey with azimuth, inclination, measured depth to XYZ. The formation grids must have an X, Y, Z, and formation name. It's also important to note that the two data sources must be projected in the same coordinate reference system with Z values referencing the same datum (e.g. TVDSS). Another useful template can be found here to convert a CRS in Spotfire. With this information the Gun Barrel function will calculate the 3D distance between the midpoints of horizontal wellbores.
After loading these data sources into Spotfire (either via Petro.ai or by directly adding the tables), click Tools > Subsurface > Classify subsurface intervals. Clicking this will bring up your "Classify Subsurface Intervals" window. Here you be prompted to fill in the dropdown menus with the relevant information.
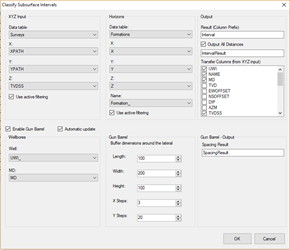
Figure 4: Classify Subsurface Intervals (and Gun Barrel) Menu
XYZ Input: Map to wellbore surveys
The top left section, shown below, is used to map columns to your wellbore surveys table. Select your wellbore surveys data table, then fill in the X, Y, and Z dropdowns. Be sure to select "use active filtering". This will allow the user to filter and mark select groupings of wells and determine the Gun Barrel distances for that select grouping.
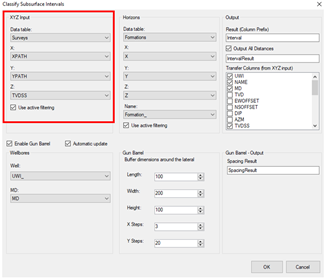
Figure 5: Classify Subsurface Intervals (and Gun Barrel) Menu: XYZ input box Horizons
Horizons: Map to surface grids
The top middle section, shown below, is used to map columns to your wellbore surface grids. Select your horizons data table. This will be a table that has your horizon grid data points. This table should contain X, Y and Z data points for each individual horizon. See below for reference. Be sure to select "use active filtering". This will allow the user to filter the surface grids around the wells of interest, which will significantly improve computation time.
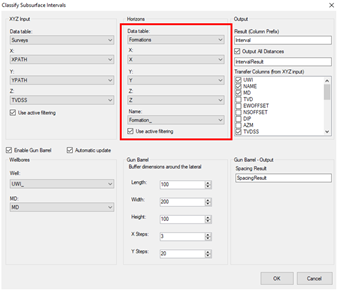
Figure 6: Classify Subsurface Intervals (and Gun Barrel) Menu: Horizons Input Box
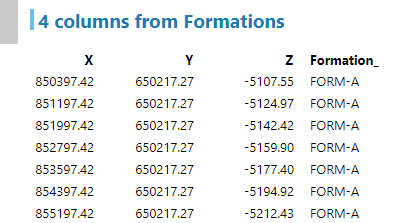
Figure 7: Formation Grids data table requirement (example)
Output: Table names and columns
The top right section, shown below, is used to configure the output table and column names. Transfer Columns are simply the additional columns that will be displayed in the output data table, check the column name boxes to include any metadata columns that will help you identify your wells.
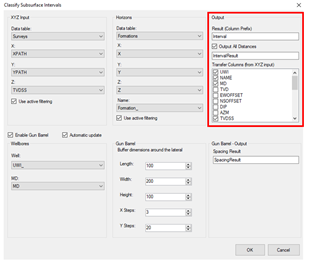
Figure 8: Classify Subsurface Intervals (and Gun Barrel) Menu: Output options
Gun Barrel Settings
The bottom half of the window shown below enables the Gun Barrel calculations to run and allows the user to configure settings for the gun barrel.
To enable the gun barrel, check the "Enable Gun Barrel" checkbox. In the Wellbores section, select the Well identifier and MD from your Wellbore Survey data table. Next, use the input boxes to define buffer dimensions around the lateral. This allows the user to update the dimensions around the laterals, creating a rectangular prism for the calculations. In general, the preset values are sufficient.
The right side, Gun Barrel – Output, is used to name the spacing result table generated by the calculation. Use the input box to update the table name. At this point, you are ready to run the calculations: click the OK button.
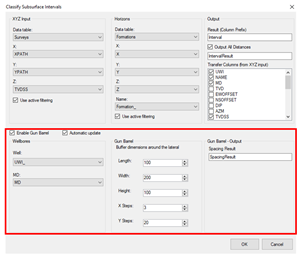
Figure 9: Classify Subsurface Intervals (and Gun Barrel) Menu: Gun Barrel Input Box
Gun Barrel Spotfire Template
With all the proper data imported and mapped, it is now possible use the Gun Barrel workflow. It's possible to run the interval classifier and gun barrel calculator in any Spotfire DXP using Ruths.ai software, but we recommend starting with the Gun Barrel Spotfire template, as it's preconfigured to automate this workflow. This template will be published soon, stay tuned for updates!
Select the Gun Barrel, mark a group of wells on the Map Chart, then click the "Update Gun Barrel" button on the left side menu. And that's it! You have kicked off the calculation for the 3D distance between the horizontal midpoints of each selected wellbore. Just monitor the Spotfire notifications area to see when the function execution completes.
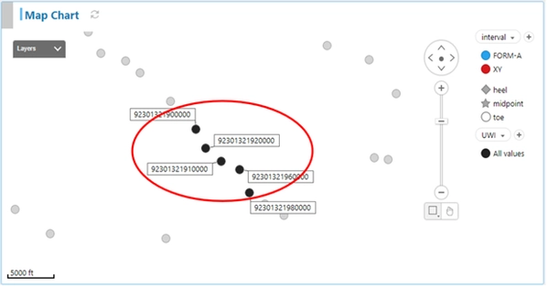
Figure 10: Map Chart: select wells
The map chart above is displaying the horizontal midpoint X Y points. Depending on your preference, you can change these to the heel or toe if you have those points available to you in your data set.
After running the gun barrel calculation, the results are displayed in four different visualizations to help the user interpret these findings. Each will be explained below.
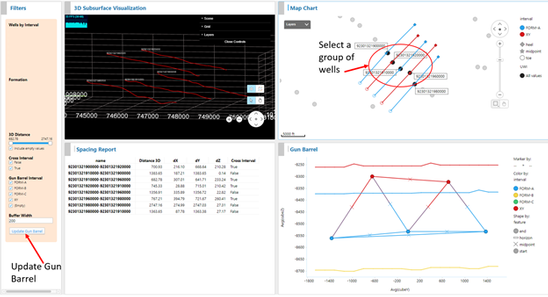
Figure 11: Gun Barrel Spotfire Template: (Side menu Update Gun Barrel Button)
The "Spacing Report" cross table shows a tabular view of the data. This takes each combination of wells and displays the 3D distance between each of the combination pairs (e.g. A to B, A to C, and B to C. This view also provides the distances dx, dy and dz of each of the midpoints between the well pairs, and a flag indicating whether the combination crosses a horizon interval.
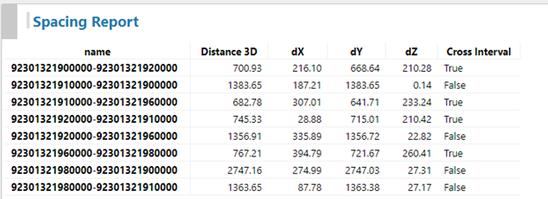
Figure 12: Spacing Report: Tabular View
A table is great for looking up specific values; now let's look at the visual representation of the same data. The Gun Barrel diagram helps to do this. The Gun Barrel diagram displays the data in a 2D vertical cross-sectional view through, and perpendicular to, all wellbore lateral section midpoints, allowing the user to view the horizontal midpoint wellbore paths head on, (as if staring down the barrel of a gun).
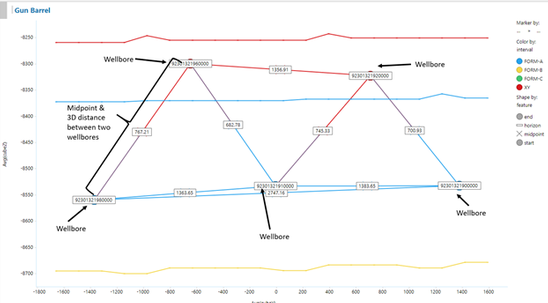
Figure 13: Gun Barrel Visualization
Important note: This is a 2D vertical cross section showing the midpoint along the lateral of the selected wells, regardless of whether they are in a direct line or are spatially staggered from a bird's-eye view.
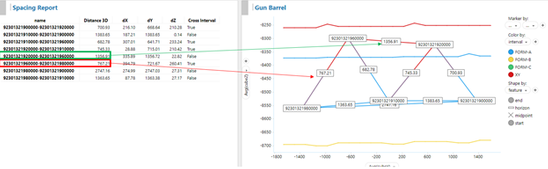
Figure 14: Using the spacing report and Gun Barrel together to interpret the data.
With these two views it is possible to quickly interpret the gun barrel calculations and visualize the spacing results.
Lastly, viewing this data in map view and a 3D subsurface view help to further orient the user to the well's spatial position in the field (shown below).
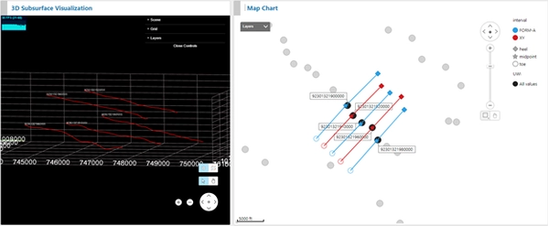
Figure 15: 3D Subsurface view and Map Chart view.
Note that the Map chart shows the horizontal portion of each selected well, with the heel and toe points colored by their respective formation intervals. In the above example, the black dots represent the lateral section midpoints of each well.
Let me know if you have any issues with the above procedure. Good luck making your gun barrel plots and spacing reports!


